Find, explain, and fix AI failures before customers feel them.
AnoSys connects traces, evals, cost, infrastructure, user behavior, and business KPIs so teams can debug incidents, control spend, improve outcomes, and govern production AI with evidence.
See how AnoSys connects AI telemetry to cost, quality, user experience, and business impact.
LLM traces, APM dashboards, eval scores, analytics, and cost reports each show part of the story. AnoSys connects them so teams can see the operational truth.
The agent succeeded. The customer still failed.
Connect output quality, user behavior, support signals, and conversion impact.
AI spend jumped. Nobody owns the cause.
Attribute token usage by team, workflow, model, agent, tool, and customer.
The eval improved. The KPI dropped.
Correlate releases, evals, traces, latency, and business outcomes in one view.
Every dashboard is green. Users are complaining.
Trace customer pain across agents, APIs, infrastructure, and business processes.
AnoSys connects traces, evals, cost, infrastructure, user behavior, and business KPIs so teams can debug incidents, control spend, improve outcomes, and govern production AI.
 AI Operational Intelligence
Ingest
OpenTelemetry, REST, SDKs, logs, evals, costs, product events, and business process signals.
Correlate
Join user, application, agent, model, tool, infrastructure, and KPI context in one timeline.
Explain
Surface anomalies, root cause, regressions, quality gaps, and spend drivers with evidence.
Debug AI failures
Find the slow span, bad tool call, failed handoff, release change, or infrastructure issue.
Control AI spend
Attribute token and model costs to agents, workflows, teams, users, and outcomes.
Improve outcomes
Compare production behavior against evals, safety, latency, user experience, and business KPIs.
Govern production AI
Monitor quality, policy, sensitive data controls, SLAs, ownership, and audit trails.
Route incidents, trigger workflows, create reports, and close the loop with the right owners.
Trace an agent run, watch the dashboards, and investigate in plain English.
Follow every agent run, span by span
Triage, handoffs, turns, LLM calls, and tool functions — laid out on one timeline with exact durations, so the slow span or stalled handoff is obvious at a glance.
Explore tracing →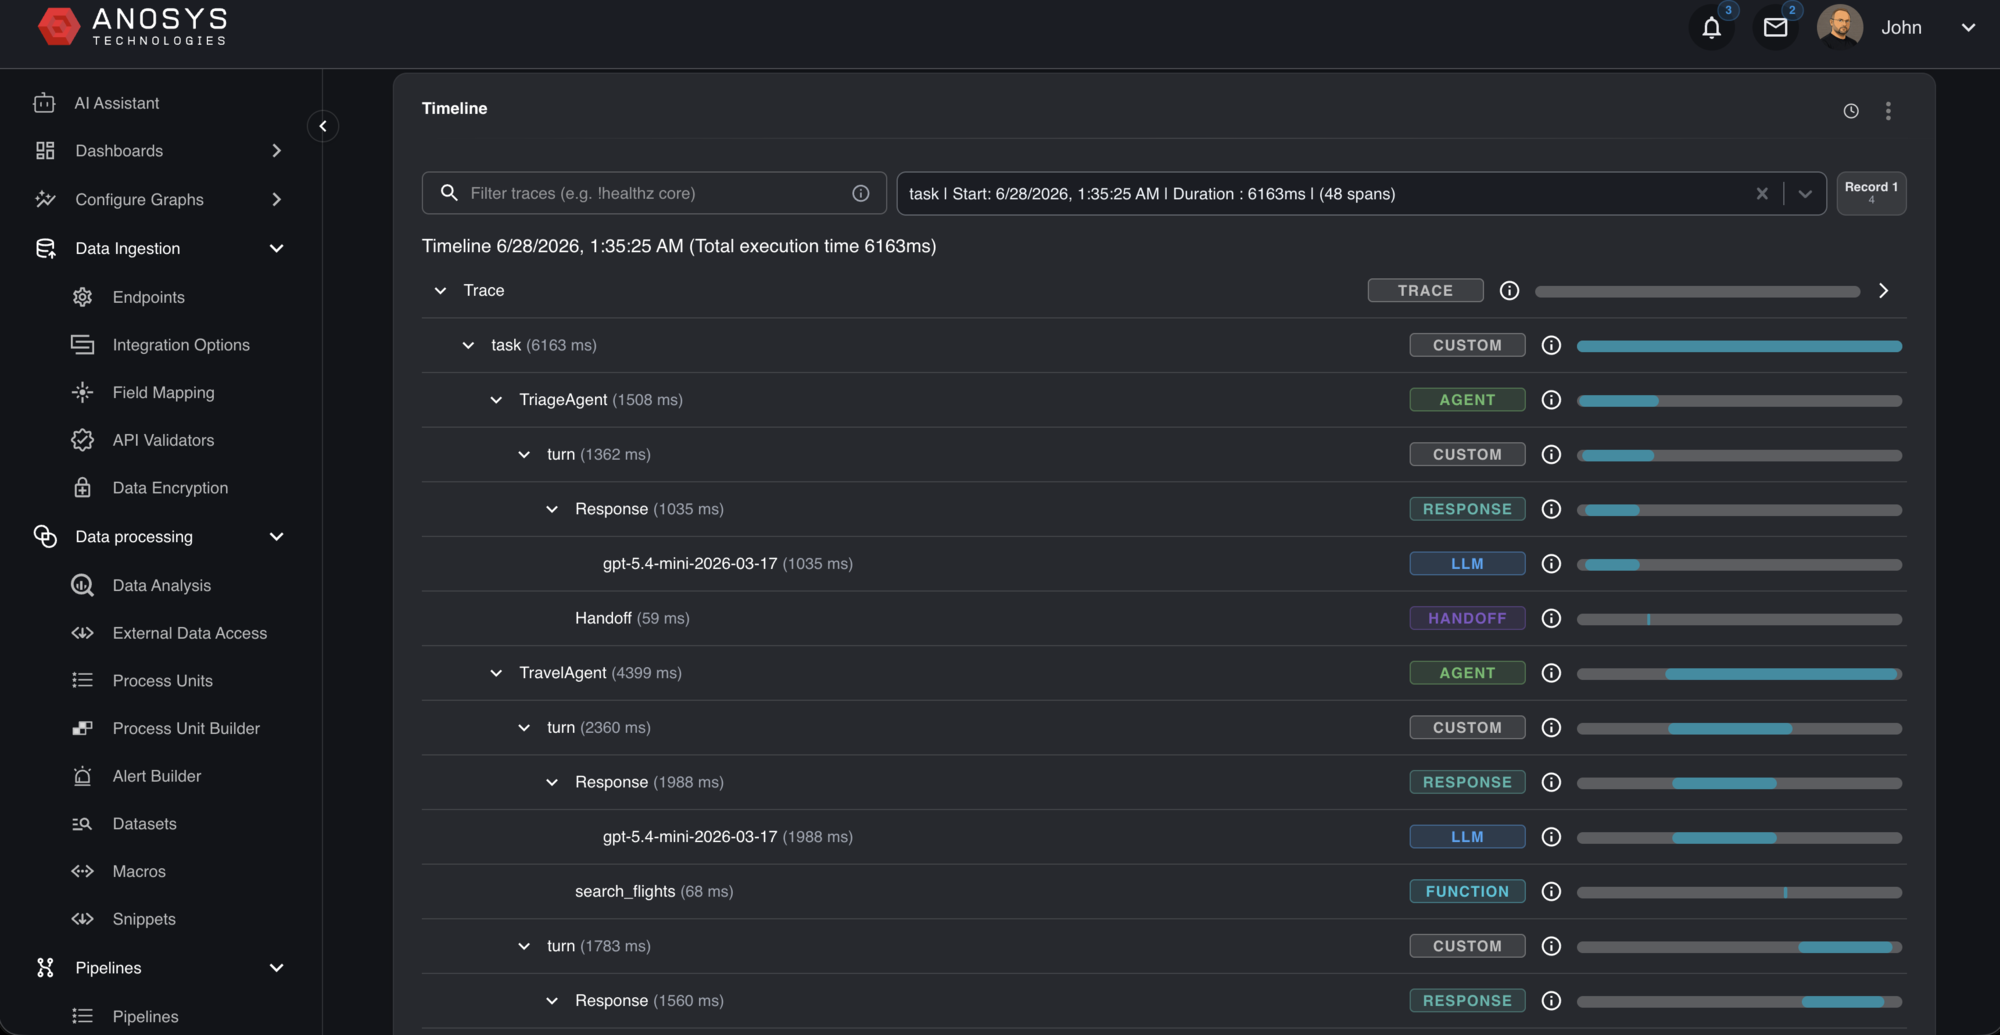
Dashboards for cost, quality, and safety
Start from a library of prebuilt dashboards or build your own — agent performance, token spend, refusals, monitoring — every tile drilling down to the trace behind the number.
Explore dashboards →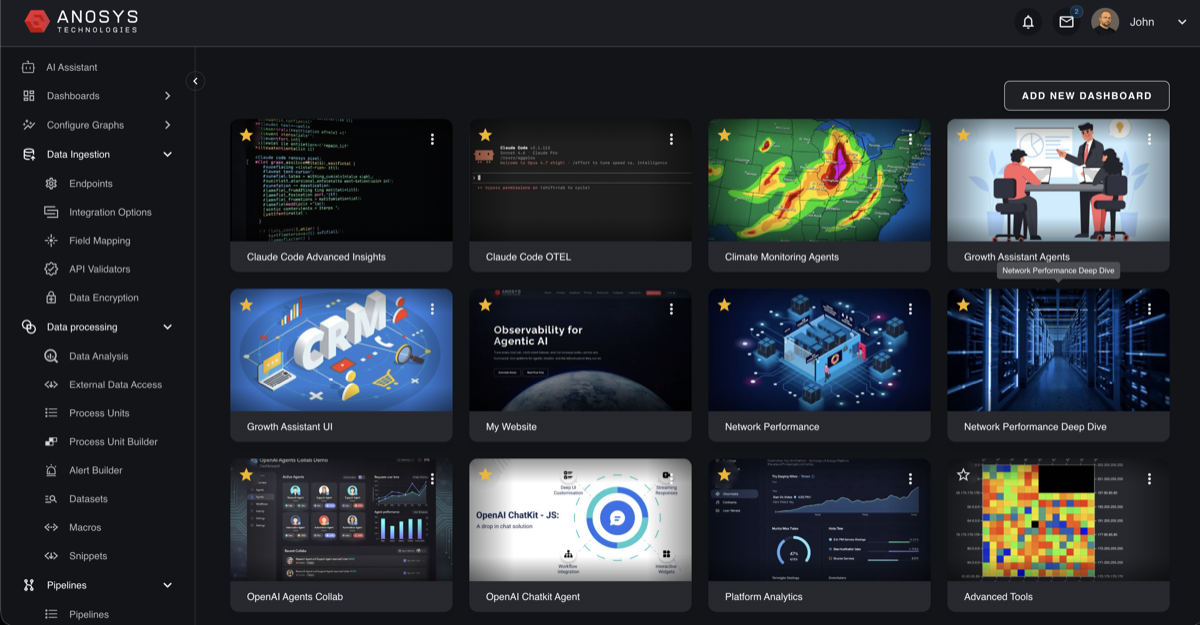
Ask in plain English with the Anosys Copilot
Pick the signals that matter — cost, latency, session quality, tool stats — and ask. The Copilot reasons over your real telemetry to summarize incidents and explain failures.
Explore the Copilot →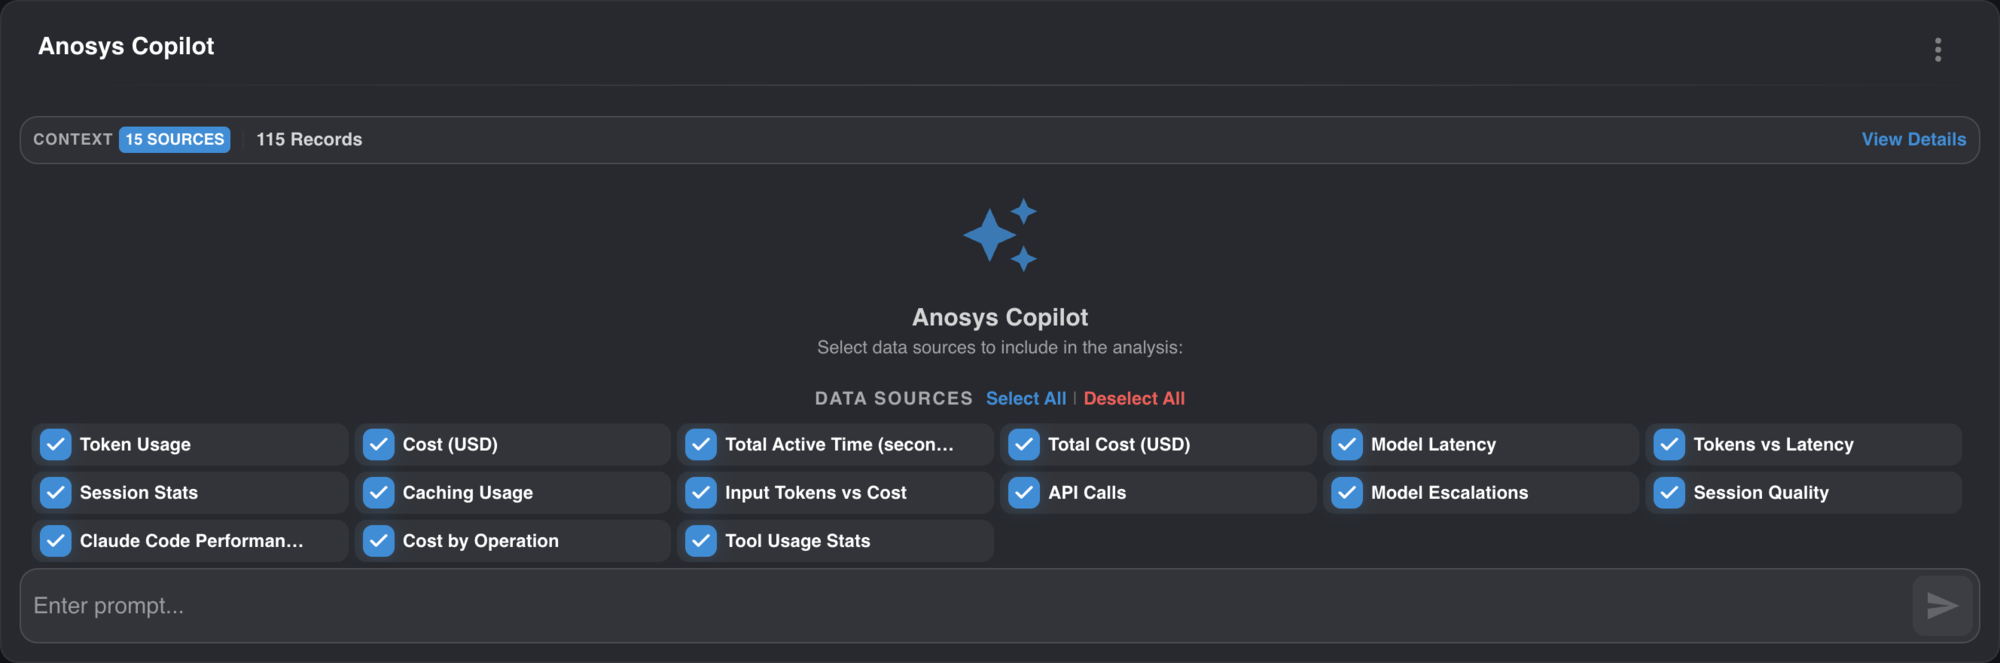
Bring AI, application, infrastructure, product, and business process data through the paths your teams already use.
Push events and metrics via standard HTTP endpoints
Native OTLP support — traces, metrics, and logs
Lightweight JS tracker and image pixel for web analytics
S3, Google Cloud Storage, FTP, and custom file drops
Start with an SDK, OpenTelemetry, REST, JavaScript, or pixel signal, then connect traces to cost, quality, user experience, and business impact.
Works with any AI agent, model, application, or business process — see all integrations →
Start with the buyer pain in front of you, then expand into one operational intelligence layer.
Start monitoring production AI for free.
Connect your first trace, inspect the console, and see how operational intelligence turns AI telemetry into action.


