Business Process Monitoring for AI-Driven Operations
The most consequential AI in your company probably isn't a chat window. It's the review step inside claims processing, the classifier that routes support tickets, the extraction model in onboarding, the fraud check between order and fulfillment. AI has moved into the middle of business processes — which means when it misbehaves, the symptom isn't a bad chat transcript. It's a stuck queue, a missed SLA, or an approval rate that drifts down for a month before anyone connects it to the prompt change that caused it.
This creates a monitoring problem that neither of the existing disciplines covers. Process monitoring tools see stages, queues, and cycle times, but treat the AI step as a black box that either completed or didn't. AI observability tools see the model's traces in exquisite detail, but have no idea the model sits inside a claims workflow with a four-hour SLA. The failures that matter happen precisely in the joint between the two.
New failure modes in old processes
What makes AI-driven processes operationally different is that the AI step can degrade the process while completing successfully. An onboarding document extractor starts escalating more cases to human review after a policy prompt change — every individual run "succeeds," and cycle time doubles. A support router keeps routing, slightly worse than before, and downstream teams inherit a growing pile of misdirected tickets. A review agent's retries make one process stage 4x more expensive per completion without a single error being thrown. And unlike a crashed service, nothing pages anyone. The process just gets slower, costlier, and worse — on a gradient rather than at a moment.
Catching that gradient requires watching both layers at once: process signals (stages, cycle times, completion and escalation rates, SLA clocks, business outcomes like approval rate or deflection) and AI signals (the traces, tool calls, evals, and token spend of the model runs inside each stage) — with the crucial property that they share keys. A process event that can't be joined to the AI run that produced it is trivia; joined, the two become diagnosis.
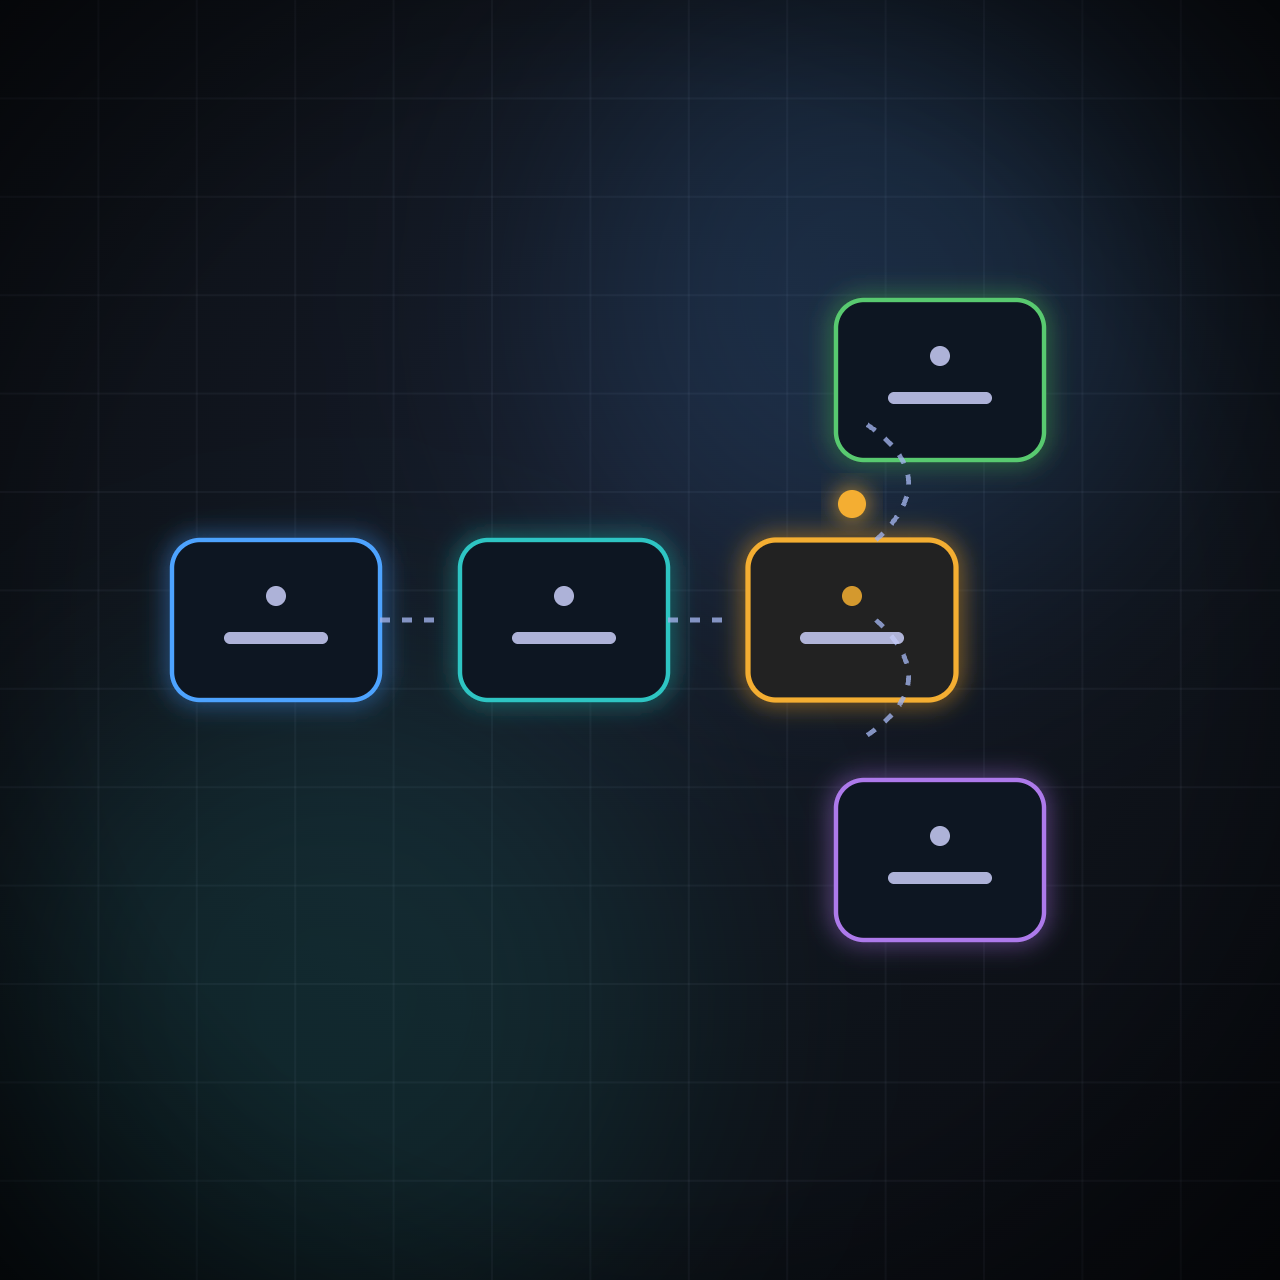
flowchart LR
    S1["claim<br/>submitted"] --> S2["<b>AI review step</b>"] --> S3["approved /<br/>escalated"]
    S3 --> KPI["completion rate<br/>cycle time · SLA"]
    S2 -. "shared keys" .- TRACE["trace · evals · cost<br/>of the run inside"]
    KPI --> RCA["<b>root cause</b><br/><i>the prompt change<br/>behind the KPI drop</i>"]
    TRACE --> RCA
    style S2 stroke:#f4ae30,stroke-width:2px
    style TRACE stroke:#4ea3ff,stroke-width:2px
    style RCA stroke:#59ca6f,stroke-width:2px
The dotted line is the entire discipline: every process event and every AI run carrying the same workflow, account, and team identifiers, so a KPI symptom can be walked back to the model run that caused it.
From symptom to cause across the seam
Here's the shape of an investigation when the layers are connected, drawn from the kind of finding AnoSys is designed to produce:
Onboarding completion dropped for enterprise accounts. The AI review step began escalating more often after a policy prompt change; workflow cost per completion rose, SLA risk increased, and the effect is isolated to one process unit.
Walk through what that sentence joins: a business KPI (completion rate), segmented by account tier, connected to a specific AI behavior (escalation frequency), attributed to a specific change (the prompt), with the cost and SLA consequences quantified and the blast radius scoped. That is a decision-ready finding — the process owner knows what happened, the AI team knows what to revert, and leadership knows who was affected. Without the joint view, the same situation generates four partial tickets in four different tools and a war room to reconcile them.
Instrumenting a process without boiling the ocean
The build-out is more incremental than teams expect, and AnoSys deliberately keeps the ingestion side flexible — process events can arrive through REST APIs, OpenTelemetry, SDKs, cloud files, JavaScript, or pixels, so instrumenting a workflow rarely means re-architecting it.
Start by defining the process explicitly: its stages, and what "worked" means in business terms — approved, resolved, converted, completed on time. Emit an event per stage transition with the identifiers that make joins possible: workflow, account, team, SLA class. Make sure the AI runs inside stages carry the same identifiers on their traces, evals, and cost records; this shared-key discipline is the entire trick. Then monitor the process the way you'd monitor a service — cycle time, completion, quality, cost per outcome, escalation rate — and let root cause analysis walk the joined data from a process symptom to whatever caused it: model, tool, app, data, or team. When something breaks, route the incident to the owner with the evidence attached.
What to measure first
The first process dashboard should not be a wall of metrics. It should answer whether the process is moving, whether the AI step is helping, and where work is getting stuck.
| Process metric | AI signal to join | What it tells you |
|---|---|---|
| Stage cycle time | model latency, tool latency, retry count | whether AI is slowing the process or waiting on a dependency |
| Completion rate | task-success eval, confidence, escalation | whether the AI step is creating more finished work |
| Escalation rate | refusal, low-confidence output, policy check | whether humans are absorbing hidden AI failure |
| Cost per completion | token spend, model route, retries | whether the workflow has healthy unit economics |
| SLA breach risk | queue age, stage duration, owner | whether action is needed before the process misses commitments |
| Rework rate | user corrections, downstream rejects, audit failures | whether the AI output is accepted by the next stage |
That last metric is easy to miss and often the most valuable. AI can make the current step faster while creating rework downstream. A document extractor that speeds up intake but increases manual corrections in review did not improve the process; it moved the cost to another team.
Good process units are operational nouns
Avoid defining process units around vague labels like "AI analysis" or "data ingestion." Name the business operation: claim review, refund approval, ticket triage, onboarding document extraction, fraud screening, price-matching exception review. Then attach the AI traces inside that unit. This keeps the conversation grounded in the work the business recognizes, not in the implementation detail the model happens to perform.
Teams that do this stop discovering AI regressions through quarterly business reviews and start discovering them through alerts, usually within hours of the change that caused them. In processes measured in claims, orders, and onboarding cohorts, that difference compounds fast.
Explore Business Process Intelligence, the Business Process Monitoring solution, and the Business Process Monitoring documentation.

