Track product analytics
Goal: understand how people use your product: which features they use, where they drop off, and how that connects to your backend and AI features. Time: about 10 minutes. You need: your app's root layout and a way to read the current user's ID.
Product analytics uses the same tracker as website analytics, added once in your app's root layout. Two things are different:
- Product mode (
data-pa="true") keeps a lasting visitor identity inside your app, which you need to follow a signed-in user across sessions. - Your own IDs (
data-cidanddata-app-session) tie each event to your user and session, so you can join it with server-side events and AI traces.
%%{init: {"flowchart": {"curve": "linear"}}}%%
graph LR
    A["Root layout<br/>tracker with data-pa, data-cid"] --> E["Website / Advertising<br/>endpoint"]
    B["Your backend<br/>events with the same user ID"] --> F["Generic / Custom HTTP<br/>endpoint"]
    C["Your AI features<br/>Anosys SDK, same user ID"] --> G["OpenTelemetry / AI Agents<br/>endpoint"]
    E --> H["One user journey<br/>in dashboards"]
    F --> H
    G --> H
Step 1. Create an endpoint and copy the component
- Create an endpoint of type Website / Advertising Tracker for your app (keep it separate from your marketing site).
- In Collecting → Integration Options → Impression, choose Next.js, React or Raw HTML and copy the snippet.
Step 2. Add it once to your root layout, with product mode and your IDs
Save the copied component (for example as components/ImpressionPixel.js) and render it once in your root layout. Pass your signed-in user's ID and your own session ID:
Then add data-pa="true" to the <Script> element inside the copied component.
Render the copied component once in your top-level App:
Inside the copied component, add script.setAttribute('data-pa', 'true'); next to the other attributes.
Use opaque IDs
Pass an internal user ID, not an email address or name. If you need to show emails in reports, map them on your side.
Result: sign in to your app and click around. The endpoint's activity graph shows calls within a minute.
Step 3. Name the things you care about
Click tracking works automatically on links and buttons. For the actions that matter to you (for example Create project or Upgrade), give the element a stable name so reports stay readable when the text changes:
Put these attributes on your shared components so every screen that uses them is covered. Add data-anosys-section to larger areas (for example data-anosys-section="billing") to group clicks by area.
Step 4. Connect backend and AI events
Send the same user ID with your server-side events and AI traces, and every view in Anosys can follow one user from click to API call to model response:
- Backend events: send
cvs1=<user id>(or any custom field you map touser_id) to a Generic / Custom HTTP endpoint. See Send any data. - AI features: pass the user and session through
get_user_contextin the Anosys SDK. See Debug AI agents.
Then name the field user_id in Collecting → Field Mapping on each endpoint.
Step 5. Build your views
- Dashboards → Templates for ready-made dashboards you can deploy and adjust.
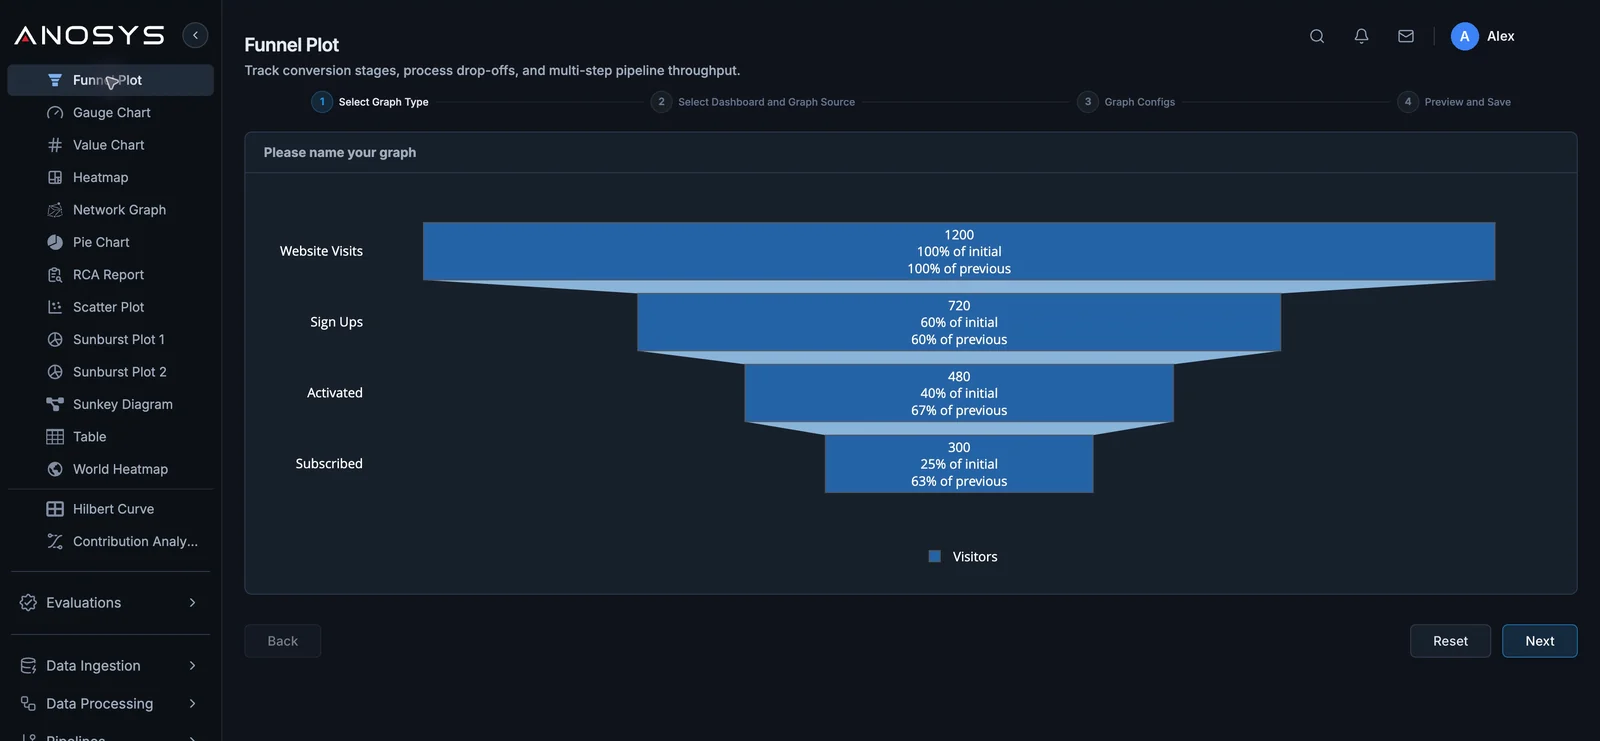
- Visualizations → Funnel Plot for sign-up or activation funnels.
- AI Assistant to ask questions such as "Which features did users who upgraded last week use first?"
A Funnel Plot from visits to sign-ups, activation and paid plans:
Website mode vs product mode
| Website mode (default) | Product mode (data-pa="true") |
|
|---|---|---|
| Best for | Public marketing pages | Signed-in apps |
| Visitor identity | Lasting only when consent allows | Lasting within your app |
| Your user and session IDs | Optional | Recommended |
Product mode asks the browser to keep the visitor identity regardless of banner choices, on the basis that your app has its own terms with the user. Check that this fits your privacy policy before you turn it on.
Next steps
- Tracker reference: every attribute and the runtime API
- Debug AI agents: add AI traces for the same users

